In order to quantify accurately how different populations respond to the number of actual founders in initial populations, a simple, exactly solved problem must be chosen. This problem must allow the comparison of dissimilarly performing genetic operators, such as the high-performing point mutation and the less powerful recombination. In addition, the populations chosen to make the comparisons must follow different evolutionary dynamics so that the results discussed here could be useful not only theoretically but also for understanding the evolutionary strategies chosen by different artificial evolutionary systems.
For this analysis, we are going to use the already familiar test sequence
(4.9) of
section
4.2.2. In all the experiments, the first 10 positive integers n and their corresponding term were used as fitness cases (see
Table
4.6); the fitness function was evaluated by equation (3.1b) and a selection range of 20% and maximum precision (0% error) were chosen, giving maximum fitness
fmax = 200; population sizes P of 50 individuals and evolutionary times
G = 100 generations were used; the success rate of each experiment was evaluated over 100 independent runs;
F = {+, -, *, /} and the terminal set T consisted only of the independent variable; and six-genic chromosomes of length 78 (head length
h = 6) linked by addition were used. The parameters of all
five experiments are summarized in Table 7.2.
Table 7.2
Success rates and parameters for a non-homogenizing system undergoing mutation
(Mut) and homogenizing systems undergoing two-point recombination
(Rec2P), one-point recombination (Rec1P), gene recombination
(RecG), and three different kinds of recombination (RecMix).
| |
Mut |
Rec2P |
Rec1P |
RecG |
RecMix |
| Number
of runs |
100 |
100 |
100 |
100 |
100 |
| Number
of generations |
100 |
100 |
100 |
100 |
100 |
| Population
size |
50 |
50 |
50 |
50 |
50 |
| Number
of fitness cases |
10 |
10 |
10 |
10 |
10 |
| Head
length |
6 |
6 |
6 |
6 |
6 |
| Number
of genes |
6 |
6 |
6 |
6 |
6 |
| Chromosome
length |
78 |
78 |
78 |
78 |
78 |
| Mutation
rate |
0.05 |
-- |
-- |
-- |
-- |
| Two-point
recombination rate |
-- |
1.0 |
-- |
-- |
0.8 |
| One-point
recombination rate |
-- |
-- |
1.0 |
-- |
0.8 |
| Gene
recombination rate |
-- |
-- |
-- |
1.0 |
0.8 |
| Selection
range |
20% |
20% |
20% |
20% |
20% |
| Precision |
0% |
0% |
0% |
0% |
0% |
| Success
rate |
96% |
0.04% |
0.03% |
0.0% |
0.13% |
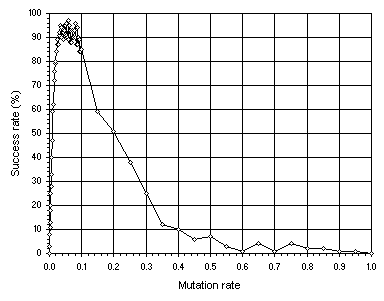
We have already seen that mutation is by far the single most important genetic operator and that populations undergoing mutation display non-homogenizing dynamics. Furthermore, mutation is the only operator capable of reaching the performance peak and, for each system, this peak can be found. For this problem, the performance peak is shown in
Figure 7.5.

Figure 7.5. Determining the performance peak using mutation alone. The success rate was evaluated over 100 identical runs.
Note that, in this case, maximum performance is reached around a mutation rate
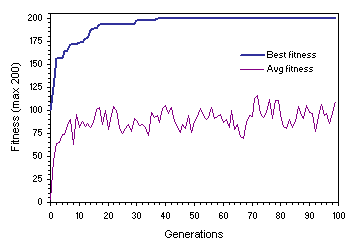
pm = 0.05. Therefore, this value will be used throughout this study. The healthy and strong non-homogenizing dynamics of
Figure 7.6 was obtained for a successful run of the experiment summarized in
the first column of Table 7.2.

Figure 7.6. Evolutionary dynamics characteristic of non-homogenizing systems. This population evolved under a mutation rate of 0.05. Note the oscillatory pattern on average fitness and the wide gap between best and average fitness.
As for recombination, this operator is the less powerful of all GEP operators and populations undergoing recombination alone display homogenizing dynamics. Furthermore, we have also seen in the
previous section that the three kinds of GEP recombination (two-point, one-point and gene recombination) perform better at maximum rates of 1.0, and that two-point recombination is the most powerful of the three recombinational operators whereas gene recombination is the less powerful. However, for the particular settings used in this analysis, when used separately, the three kinds of recombination perform so poorly that the three recombinational operators were combined together so that the performance of the algorithm increased a little (see
Table 7.2). Note that the success rate increases slightly comparatively to the individual performances obtained for the recombinational operators working separately. Thus, for this study, we will choose the general settings shown in the fifth column of
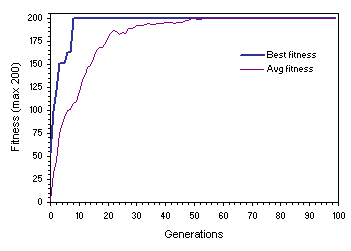
Table 7.2. Notwithstanding, these populations exhibit the same kind of homogenizing dynamics characteristic of populations undergoing only one type of recombination at a time
(Figure 7.7). This further reinforces the hypothesis that recombination is conservative and, therefore, plays a major role at maintaining the status quo. Note that, in this particular case, by generation 54 the plots for average and best fitness merge and all individuals become genetically identical. This might be seen as a good thing especially if all the individuals became equal and perfect. Recall, however, that in complex real-world problems, as in nature, there is no such thing as perfection and minor improvements are always possible.

Figure 7.7. Homogenizing populations undergoing extensive recombination. This dynamics was obtained for a successful run of the experiment summarized in the fifth column of
Table 7.2.
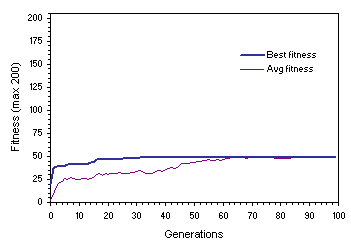
The disadvantages of such an evolutionary strategy, however, become evident when average fitness reaches best fitness before a perfect or good solution is found.
Figure 7.8 shows such a case where the population stabilized on a mediocre solution. In this case, after generation 86 adaptation becomes impossible because all individuals share the same genetic makeup. Indeed, the small success rates typical of populations undergoing recombination alone (see, for instance,
Figure 7.1 and Table
7.2) indicate that, most of the times, homogenizing populations converge before finding a good solution because they became irrevocably stuck in some local point, not necessarily optimal.

Figure 7.8. Convergence on a mediocre solution in homogenizing populations. The parameters used in this experiment are exactly the same as in
Figure 7.7.
It is worth noticing that in the experiments summarized in Table
7.2, totally random initial populations were used and, therefore, the number of viable individuals in those initial populations was not controlled. In the
next section I will show how the number of viable individuals in initial populations can be rigorously controlled in order to analyze the founder effect in artificial evolutionary systems.
|


